
I Reviewed My Amazon Business in 10 Minutes (February Recap) 🚀
It’s already March, and that means one thing—it’s time to review my business performance for February.
My goal? Get clear insights and actionable steps in just 10 minutes. Let’s go! 🔍
Step 1: Checking Overall Sales & TACoS 📊
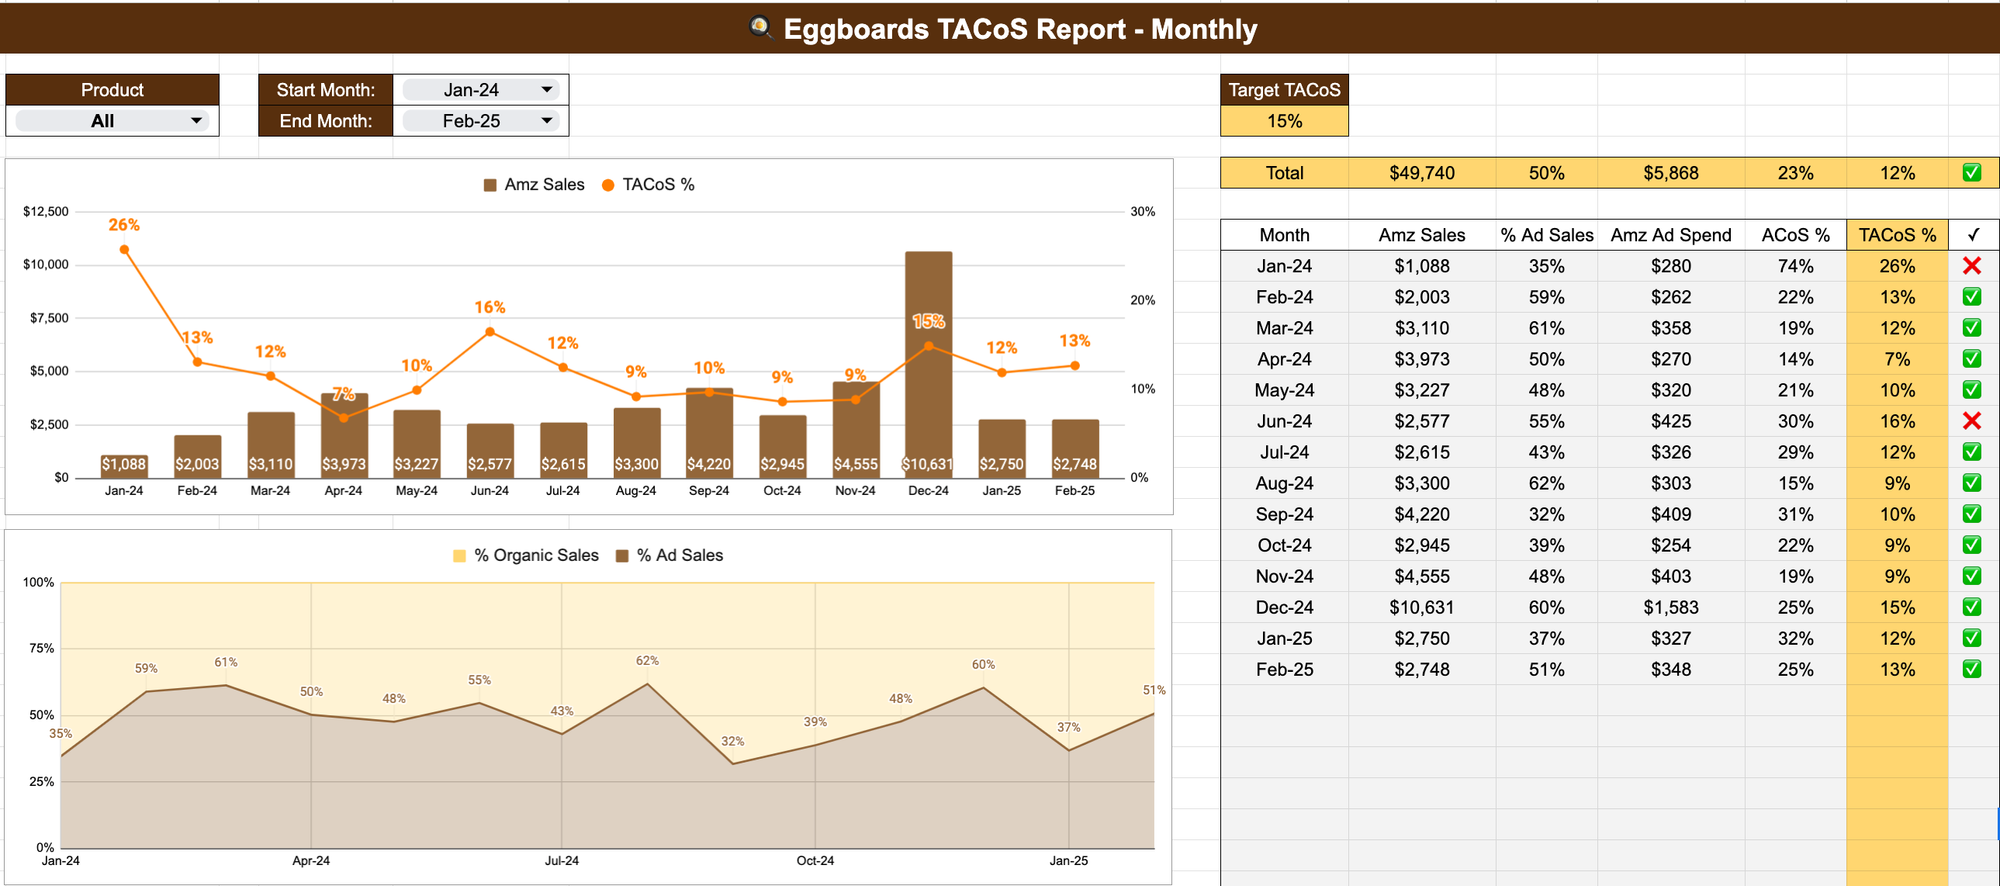
First, I dive into my main sales dashboard. Here, I focus on total sales and TACoS (Total Advertising Cost of Sales). My goal is to keep TACoS around 15%—that way, I know I’m spending efficiently on ads.
📌 February vs. January:
- Sales were nearly the same, but ad spend was slightly higher.
- The split between organic and ad-driven sales shifted. In January, I relied more on organic sales (great for profitability). But in February, 51% of sales came from ads, meaning I spent more to achieve the same results.
Not ideal! Time to investigate. 🕵️
👉 Sign Up to Download the TACOS Calculator
Step 2: Deep Dive into Product Performance
Eggboards Skateboards
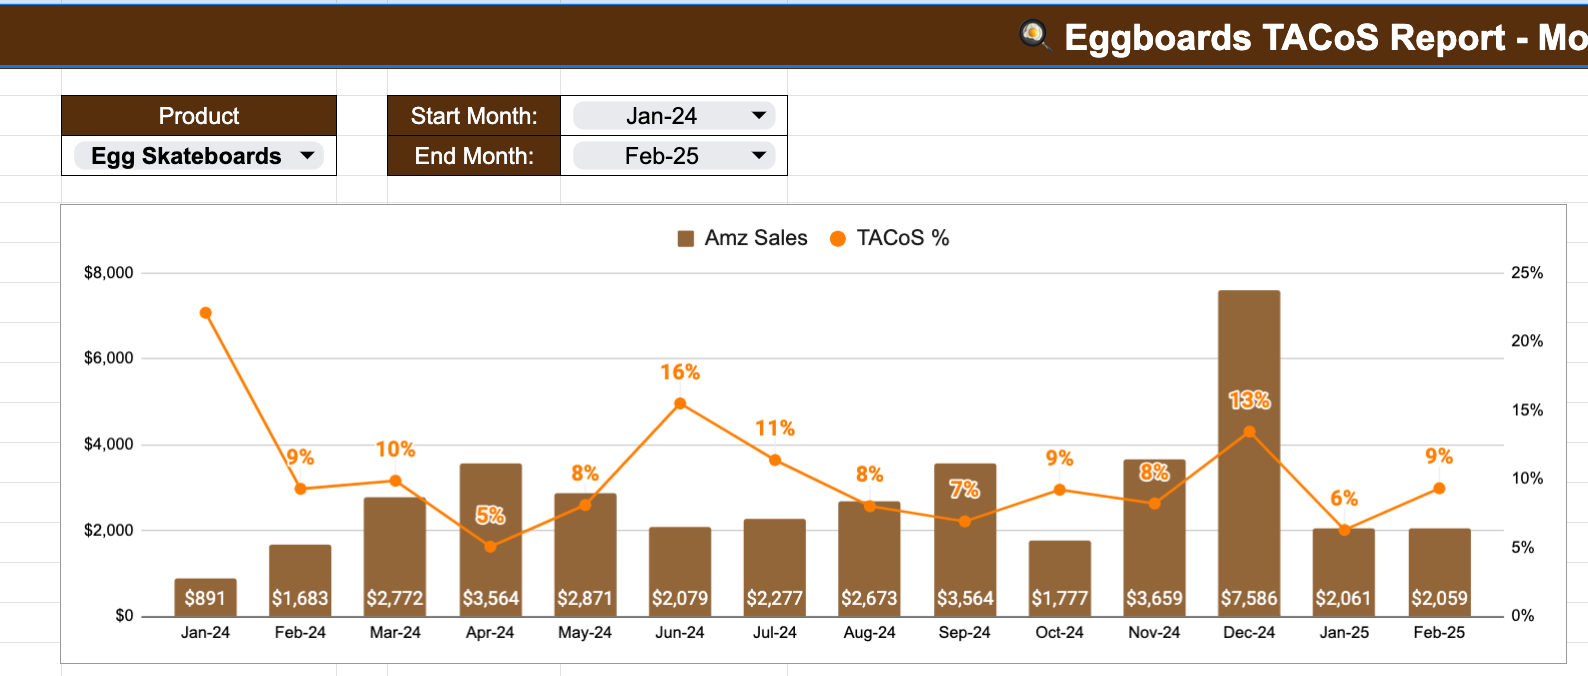
Eggboard Skateboards (my main product) showed steady sales, but TACoS increased by 3%. While still below 15%, I need to understand why I’m spending more for the same sales.
Skateboards Lights 💡
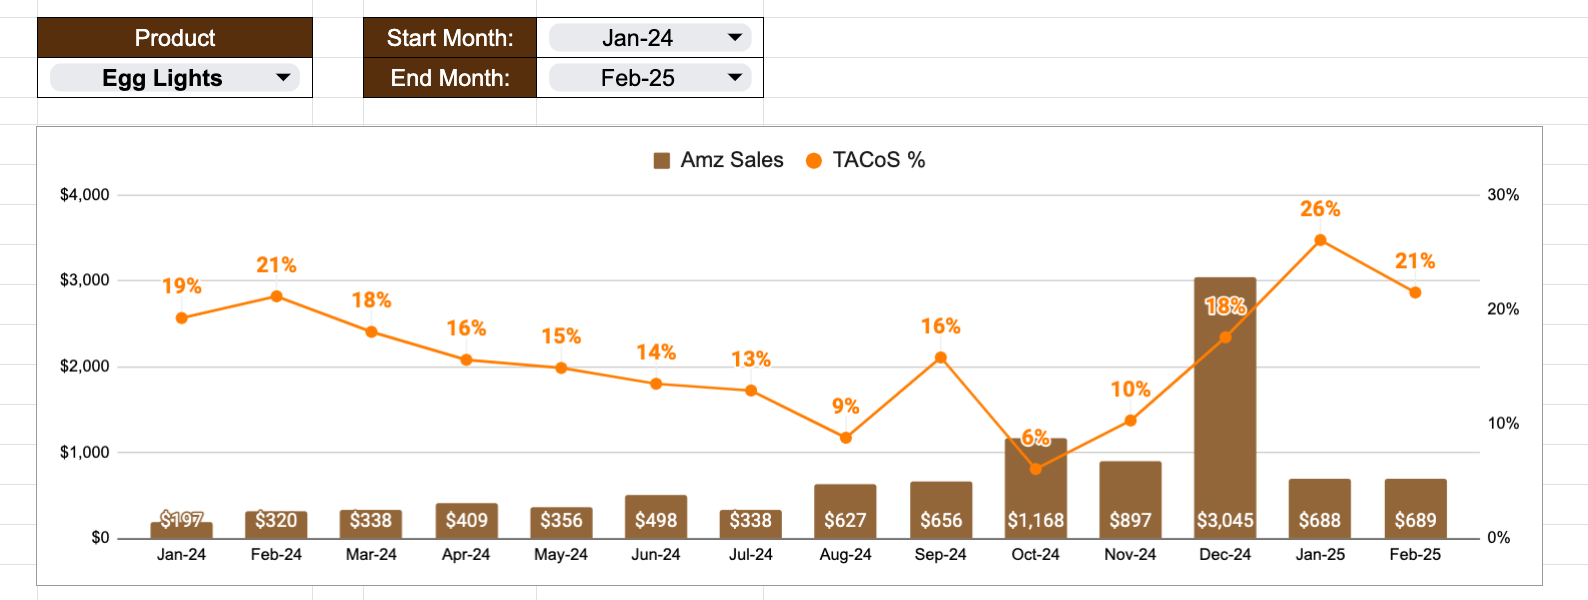
My skateboard lights had 26% TACoS in Jan25.
Advertising spend was taking all my profits and I definitely needed to reduce it!
In February we got the same sales with lower TACoS 🎉
📌 What I tested:
- I raised prices and lowered ad spend to see if I could maintain profitability.
- Results? Some improvement, but TACoS is still too high (21%). Not enough of a shift.
- Action item: Increase prices further and optimize ad spend even more.
Step 3: Organic Sales Breakdown 🔍
Organic sales = free money. The more I rank naturally on Amazon, the less I need to spend on ads.
For this, I use a separate spreadsheet to analyze click-through rate (CTR), traffic, and conversion rate.
✍ Key insights:
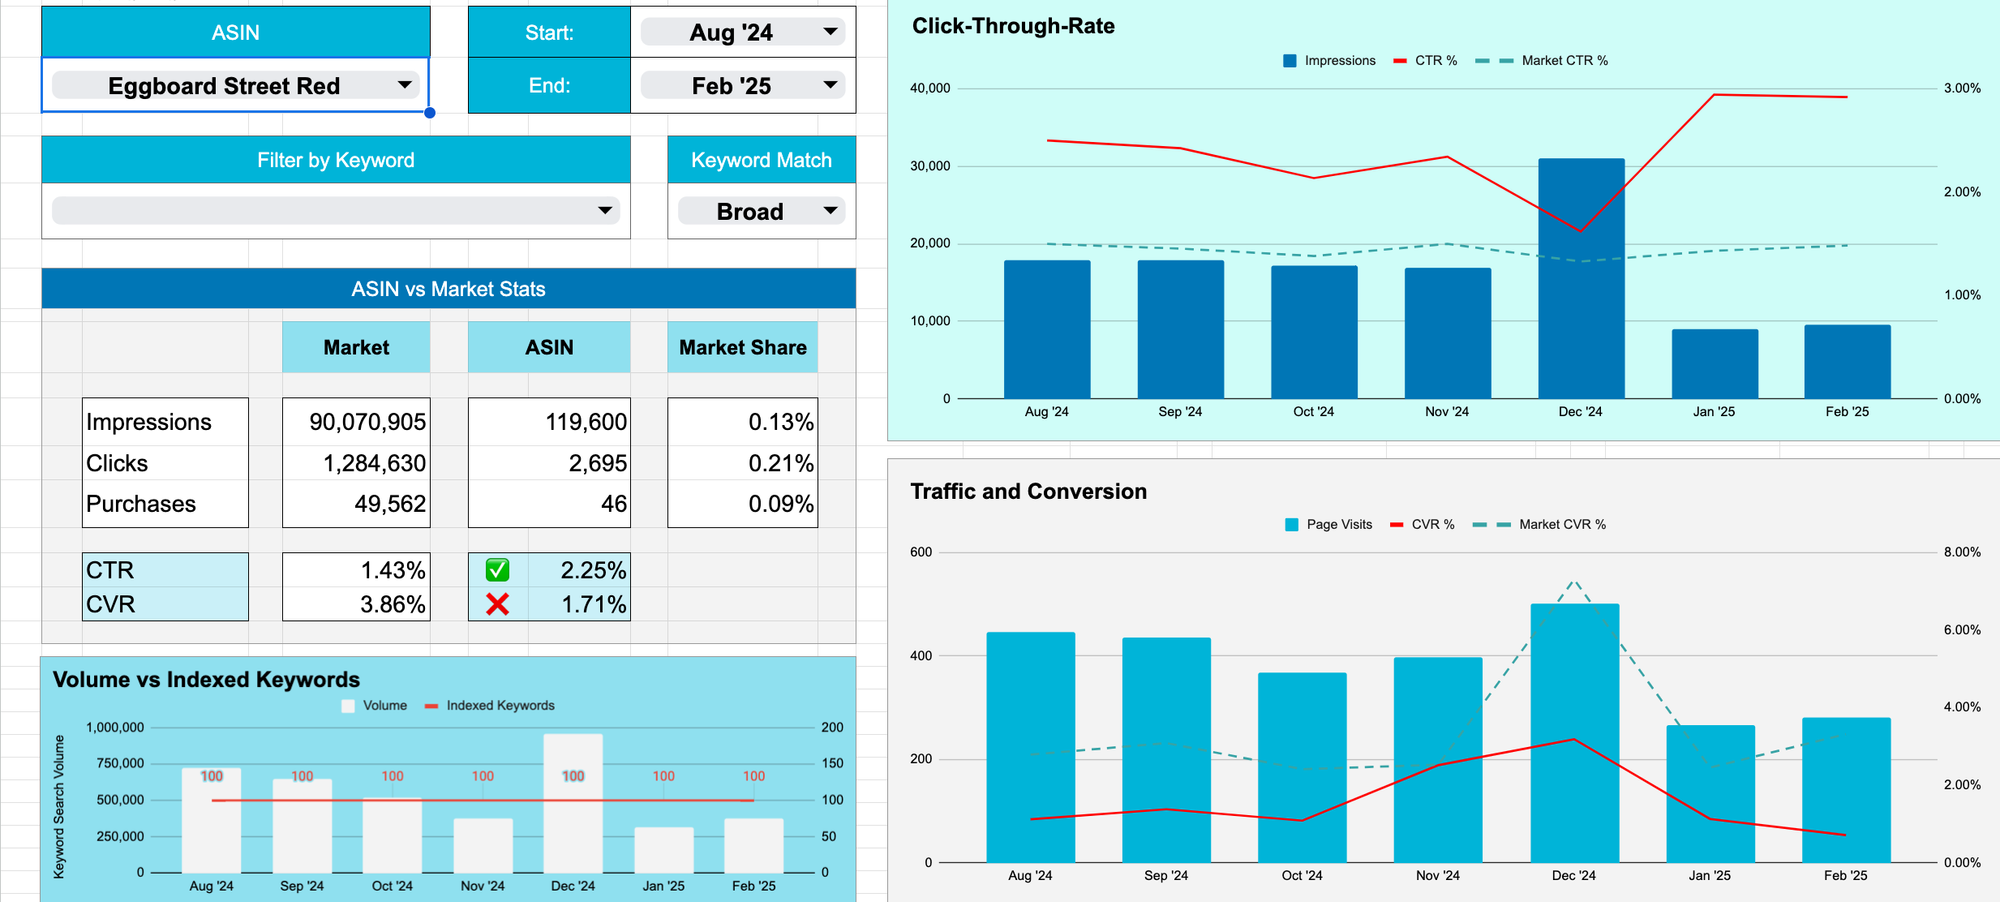
Eggboards Skateboards. Click-through rate is solid (better than market average!), but conversion rate dropped. This tells me people like my product, but something stops them from buying. 🤔
✅ Action item:
Run A/B tests on product detail images to improve conversion. People are clicking—now I need to make sure they buy!
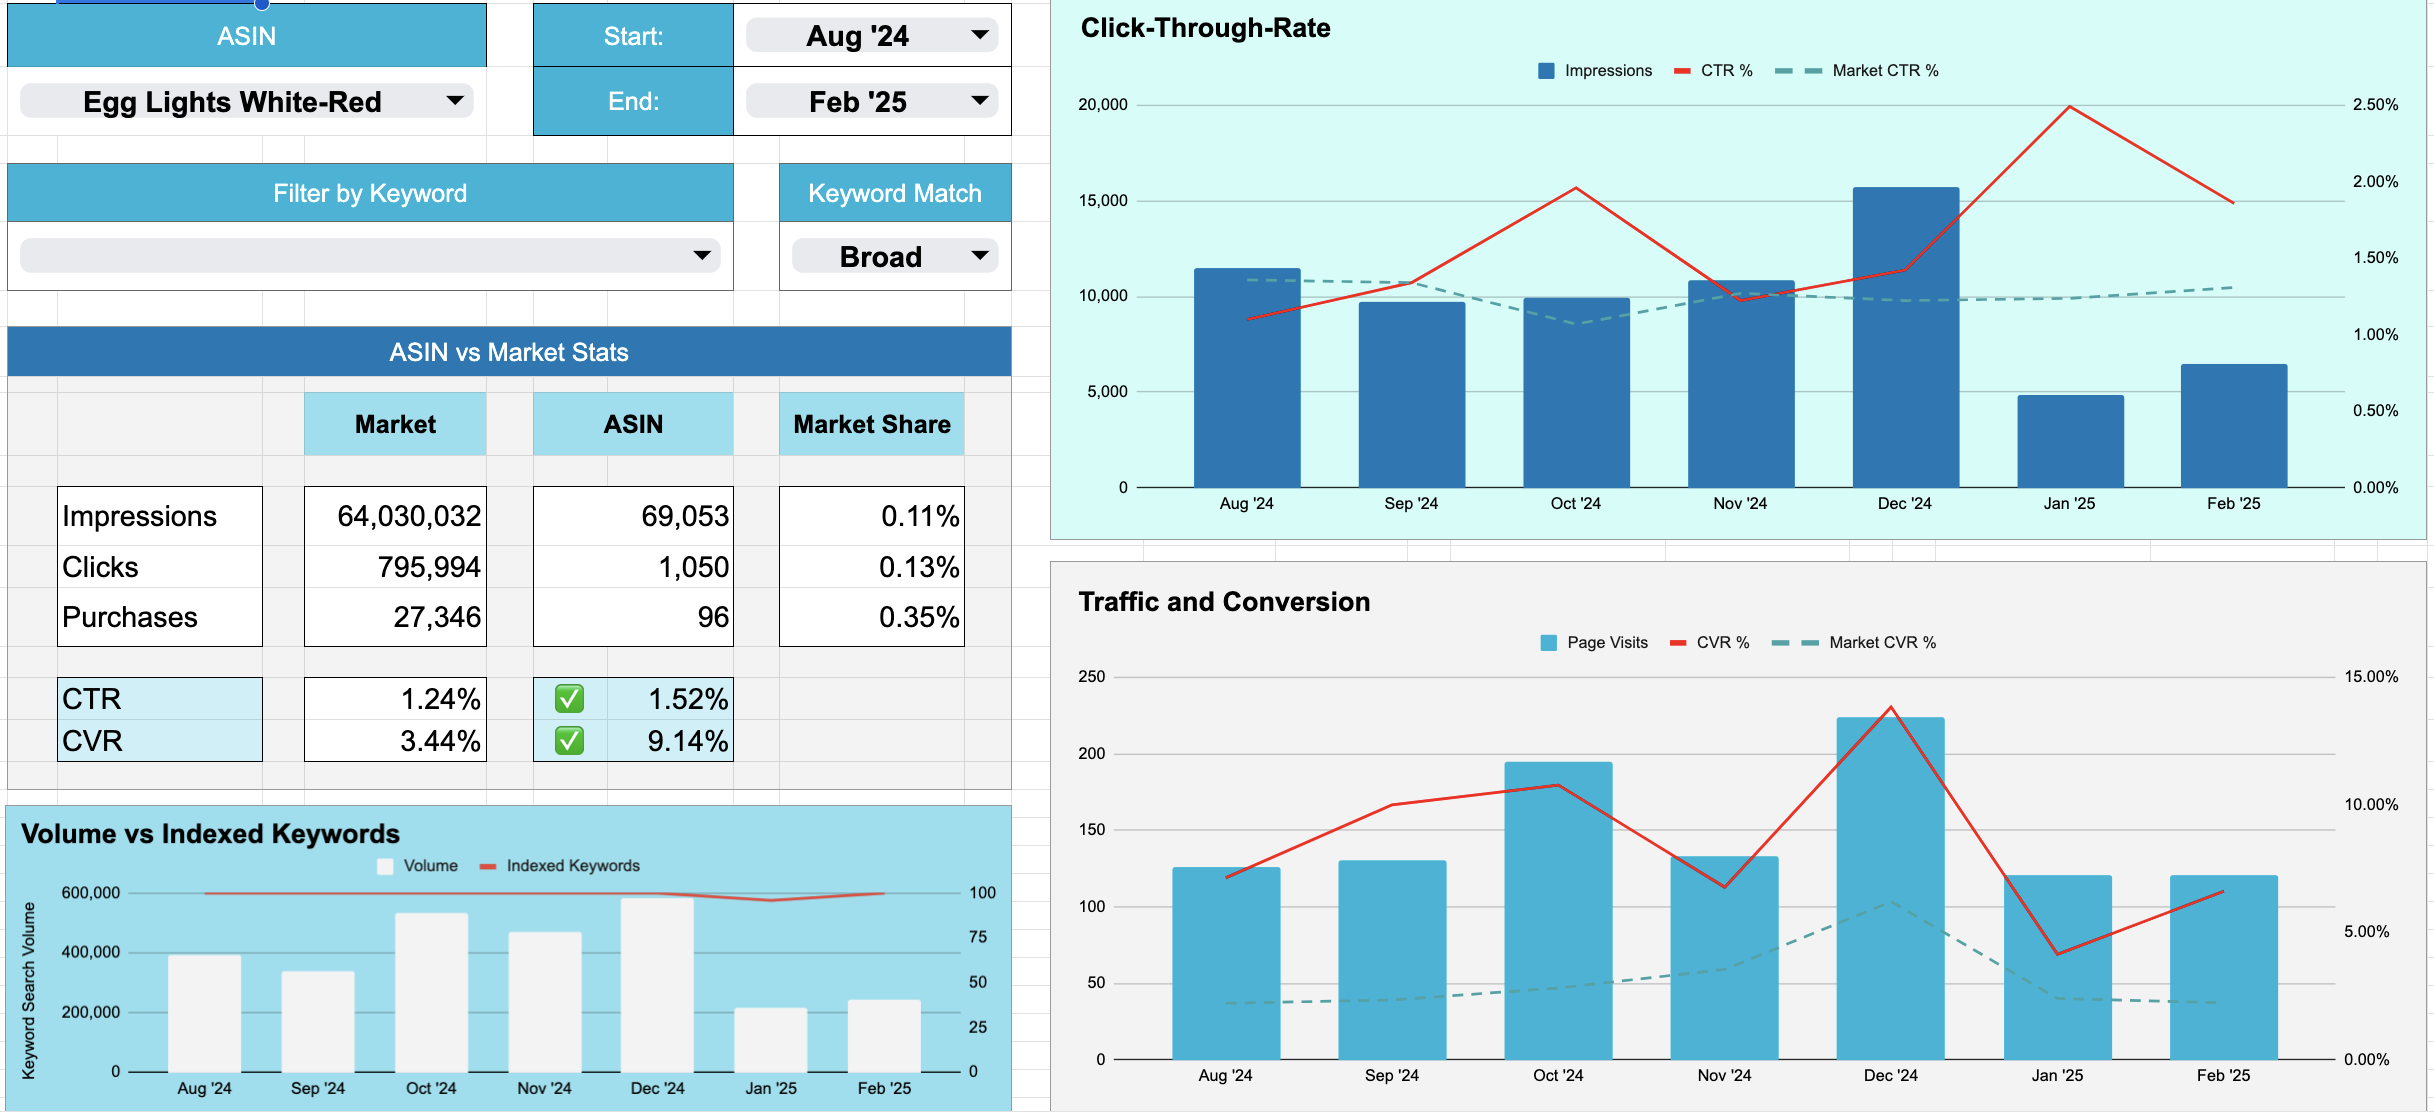
Skateboard lights: Click-through rate dropped slightly (likely due to price increases), but conversion rate remains well above market average.
✅ Action item:
Keep increasing prices and monitor organic sales to confirm that CTR and conversion hold.
Step 4: Profit & Loss Check 💰
A business can have strong sales but still lose money—so I check my profit & loss in QuickBooks.
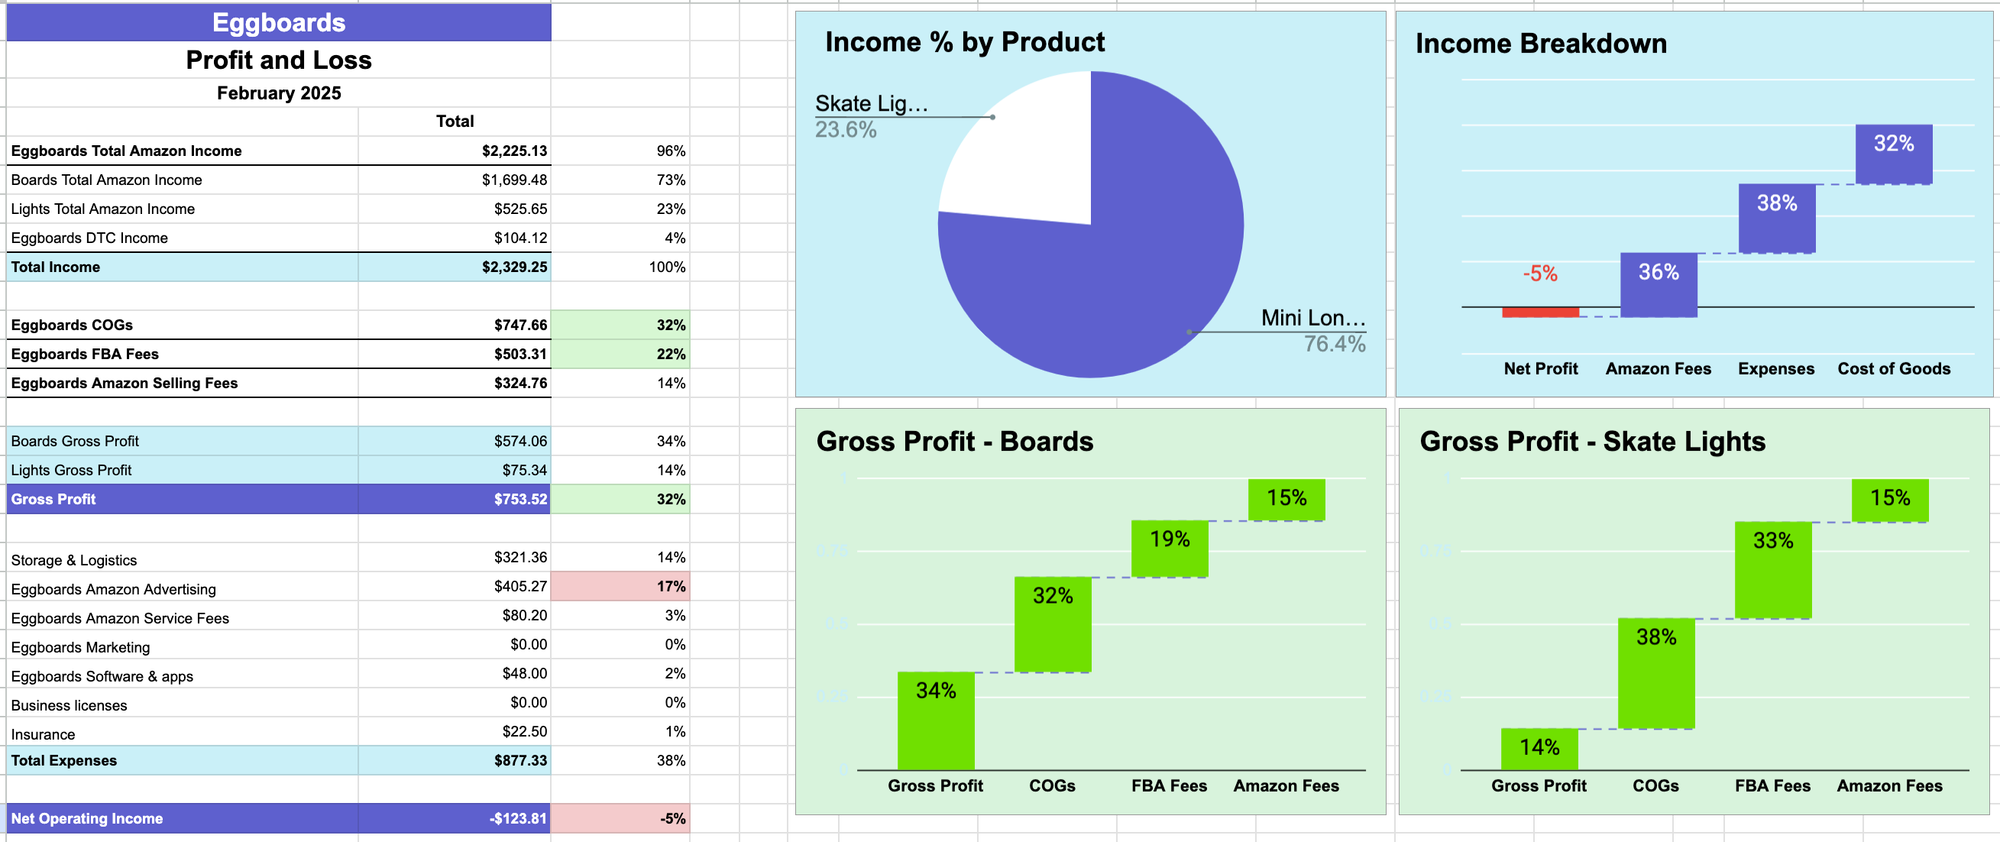
👉 Sign Up to Download the Profit & Loss Sheet
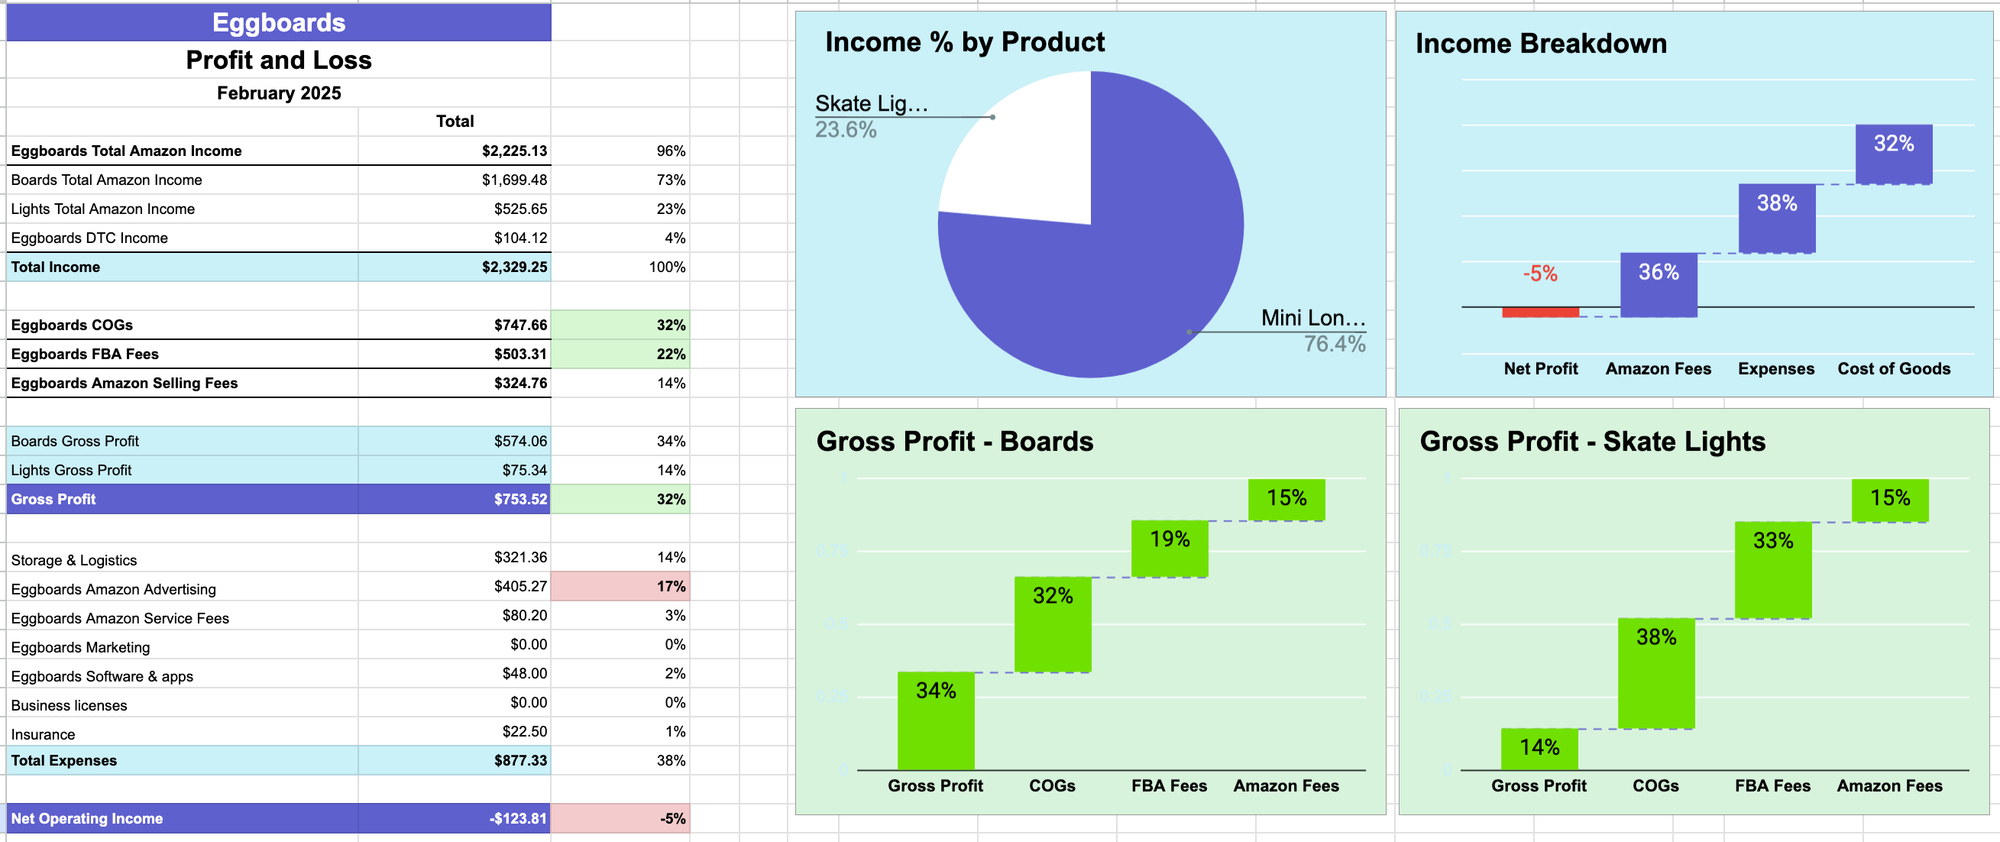
📌 The bad news: February’s net profit was -5% 😬.
Comparing with January, total sales were similar, but gross profit dropped from 39% to 32%.
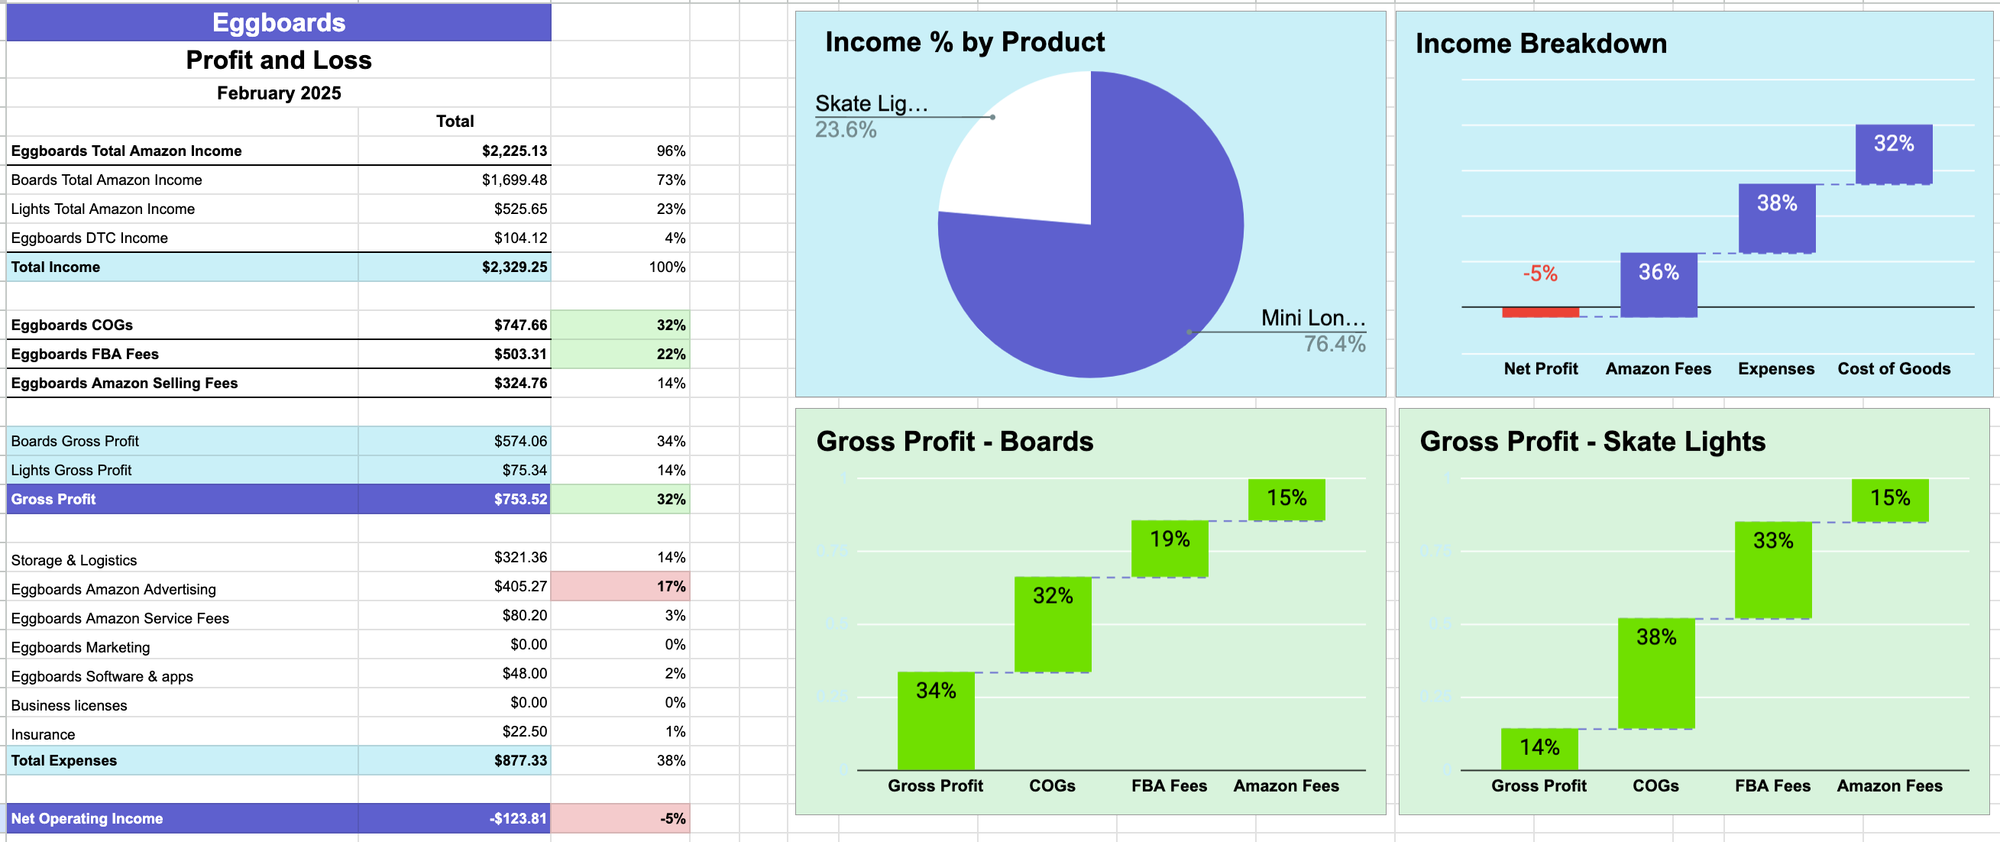
Why? High return rates on Eggboards. Returns accounted for 20% of skateboard revenue, which hit profitability hard.
✅ Action item:
Investigate return reasons and find solutions (product tweaks, better customer expectations, etc.).
Final Thoughts: Lessons & Next Steps 📅
February wasn’t great—sales were stable, but high TACoS and return rates hurt profits. The silver lining? It’s the slowest season for my business.
Action Plan for March:
- ✅ Optimize pricing & ad spend for Lights
- ✅ Improve product detail images to boost conversions for Skateboards
- ✅ Analyze return reasons to reduce losses
That’s it for this month’s review! If you want to use the same spreadsheets I do, you can download the TACOS Calculator or the Profit And Loss Sheet.. 😉
👉 Sign Up to Download the Google Sheet templates
Member discussion