
Amazon Search Query Performance - Replace Helium10
Amazon Search Query Performance gives you better keyword data than Helium10 or Jungle Scout and it's free. Use my Google Sheet for quick insights.
Did you know that if you're enrolled in Amazon Brand Registry, you have access to goldmine-level data that people usually pay big bucks for?
I’m talking about the Search Query Performance Report inside Amazon Brand Analytics—a tool that can give you real keyword volume straight from the source 🧠📈.
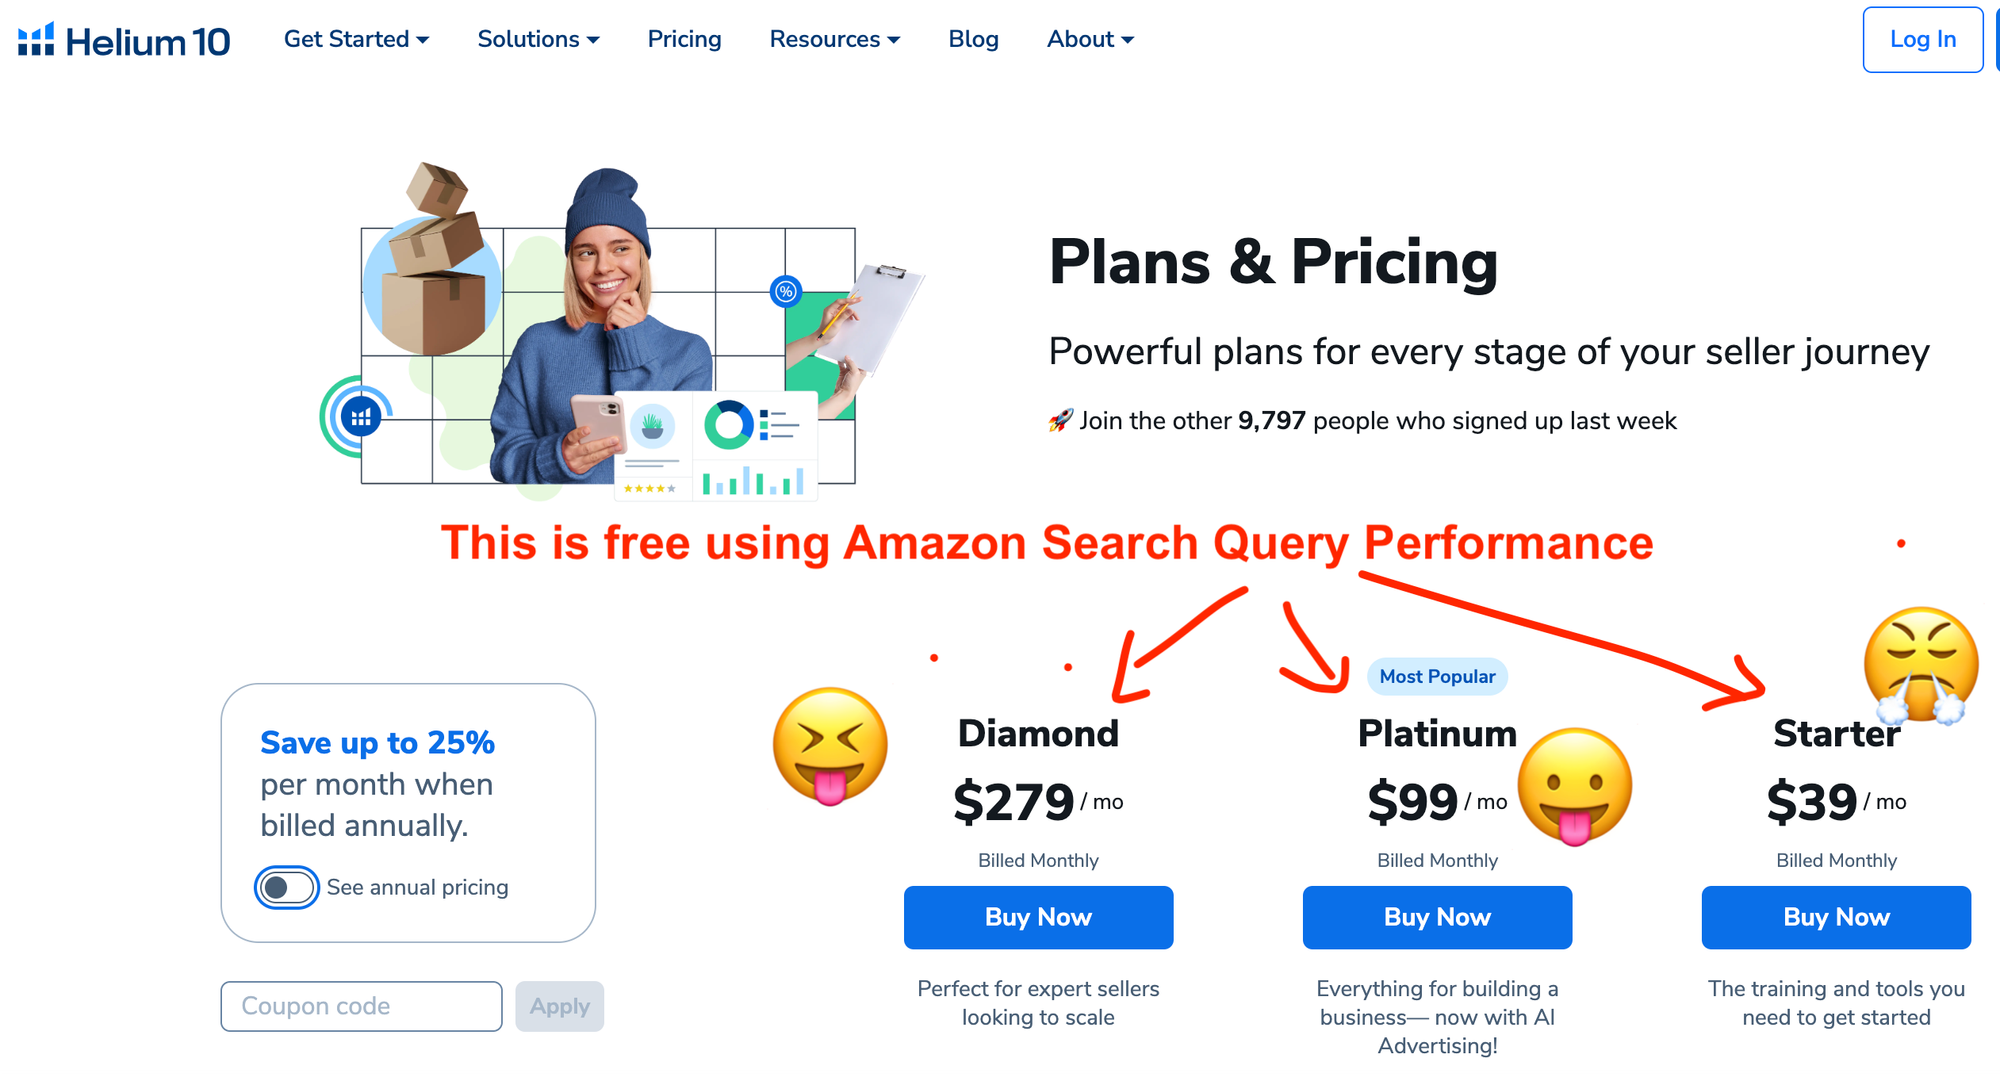
Tools like Helium 10 and Jungle Scout charge between $100–$500/month to estimate this kind of info. Meanwhile, Amazon gives it to you for free. Wild, right?
Let’s walk through what this is, how to get it, and how you can actually use it to grow your sales on Amazon.
What Is Amazon Brand Analytics?
💼 If you're enrolled in Brand Registry (which requires a pending trademark) , a whole new menu appears in your Amazon Seller Central dashboard. It's like opening a hidden treasure chest of insights 🧳✨.
Check my post on how to file a trademark using ChatGPT and save hundreds of dollars of legal fees 💰
Among the many tools now at your fingertips, one stands out for keyword nerds like us: Brand Analytics.It's a set of reports that would make any Helium 10 user jealous.
Today, we’ll focus on just one: the Search Query Performance Report. This report is a beast, and we’re gonna tame it—one post at a time.
👉 In fact, I created a simple Google Sheet to help you use this data like a pro. You can download it here.
Why This Report Matters (and Why It's Better Than Paid Tools)
You probably already know this: keyword volume is the lifeblood of Amazon SEO.
When you know what customers are searching for, you know how to position your product. Here’s the thing—third-party tools estimate this data. 💸
But Amazon? It gives you the real stuff.
And it's not just raw volume. Amazon tells you:
✅ The keywords your product is ranking for
✅ How many people searched those keywords
✅ And how your product (and your competition) performed
🔥 This is next-level visibility.
The Focus of Today’s Post: Keyword Volume Only
The Search Query Performance Report gives you a lot of numbers. But today, we're zooming in on the first column: Search Query Volume. 🧐
This data is not available via API calls, so Helium 10 and Jungle Scout have to guess it. You don’t have to.
With Brand Analytics, you get:
📅Weekly, monthly, or quarterly snapshots
🔍The top 100 keywords your product (or brand) ranks for
🧪Volume directly from Amazon's internal data
It’s like going to the source instead of buying a watered-down version at a premium.
Look at Helium 10 pricing page! 😱😱😱
The Power of Amazon Search Query Performance Over Time
Sure, the report only shows a hundred keywords per ASIN or brand per period. But guess what? They change every month! 📊
That means if you export and combine a few months of reports…
🥁 You get a rich, ever-growing list of keywords your products rank for.
And you can organize it beautifully in the Google Sheet I built for you.
👉 Get it here and follow along 😄
How to Use the Volume Data Effectively
So you have your 100 keywords and their volumes. What now?
I export a few months of datainside my Google Sheet I start diving deeper.
Here are two things I always do:
1. Use Amazon Search Query Performance to Spot Keywords That Convert
“Skateboards” might get 300,000+ searches a month. Cool. But it’s too broad. I’ve ranked for it and sold… maybe one unit.
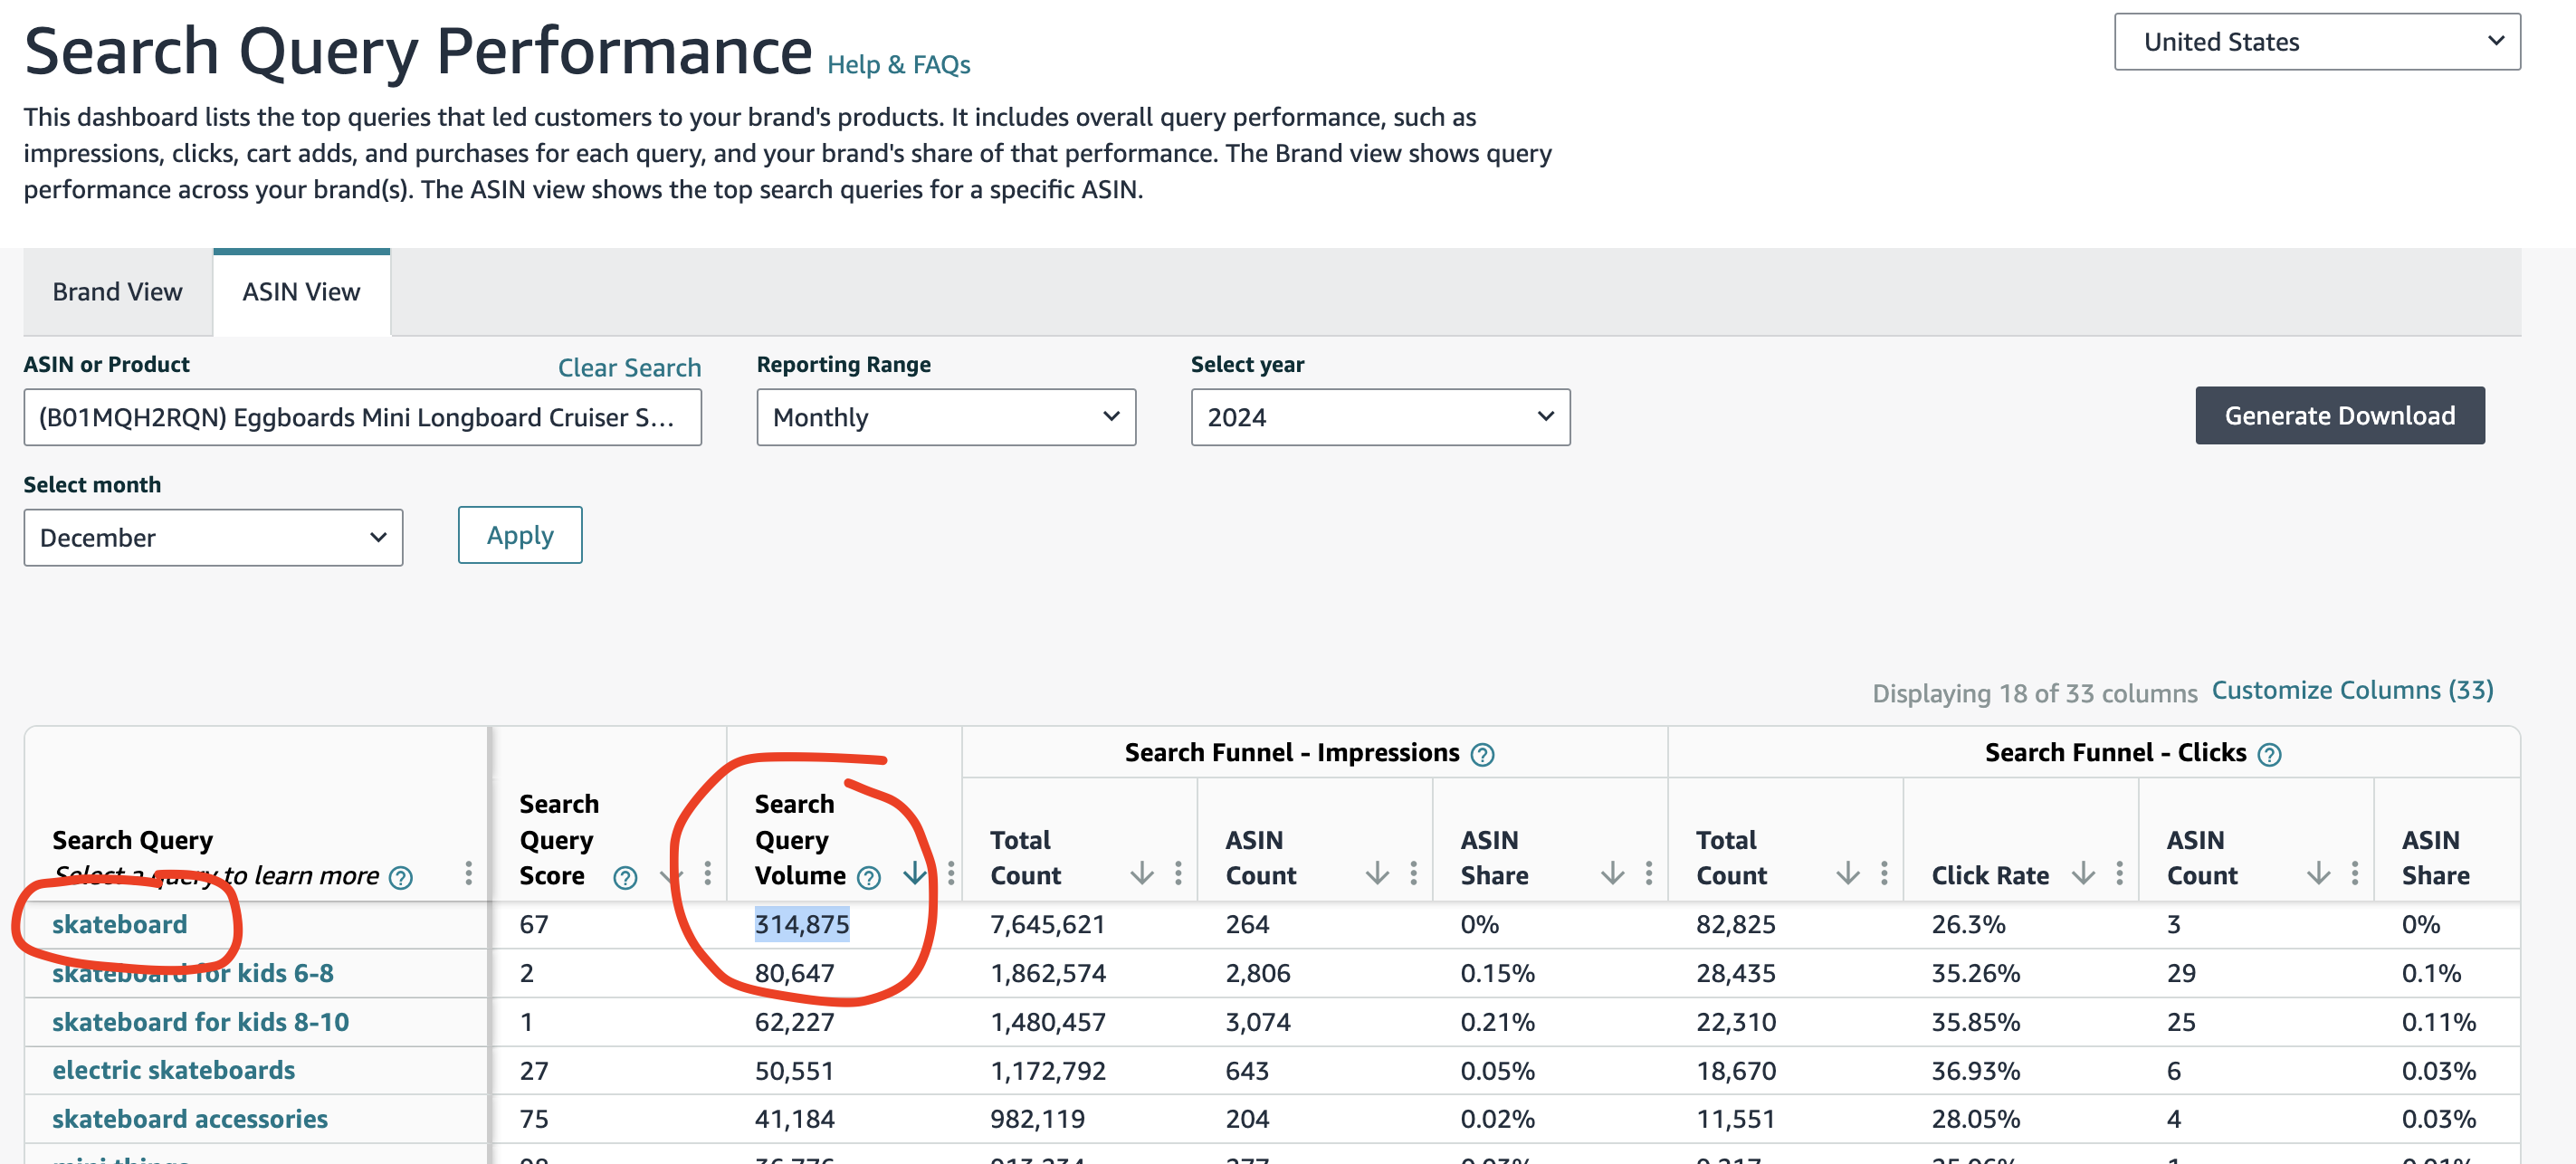
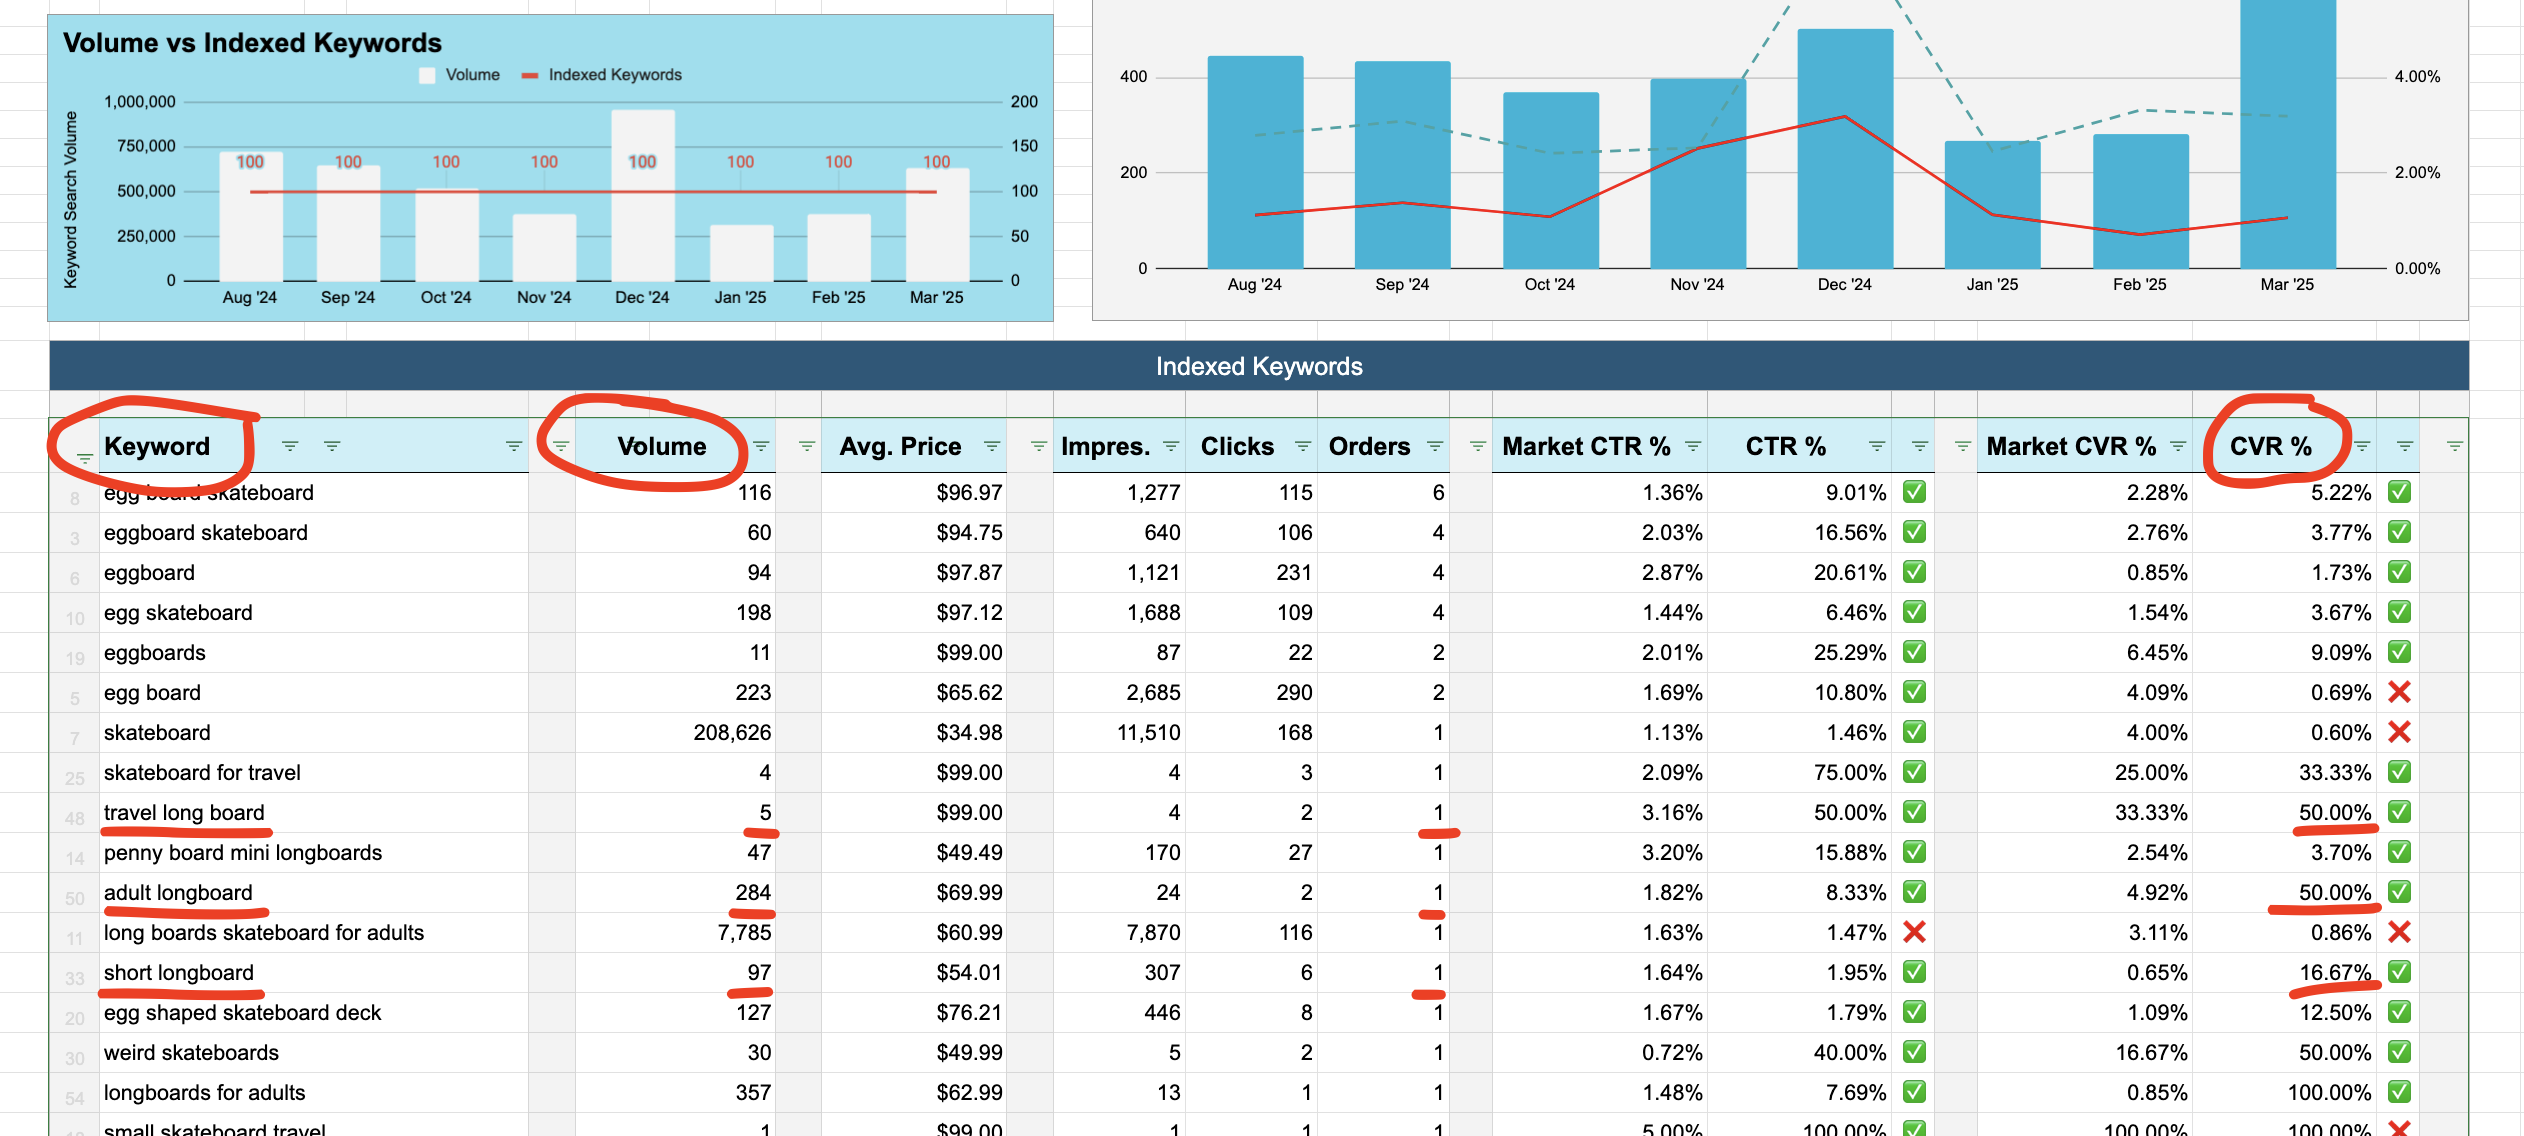
Instead, I focus on long-tail keywords like:
- “Travel Longboard”
- “Adult Longboard”
- “Short Longboard”
They might have only 10–300 searches each, but they convert like crazy. And the more I sell on them, the more Amazon rewards me for the big ones later. 🍕➡️🍕
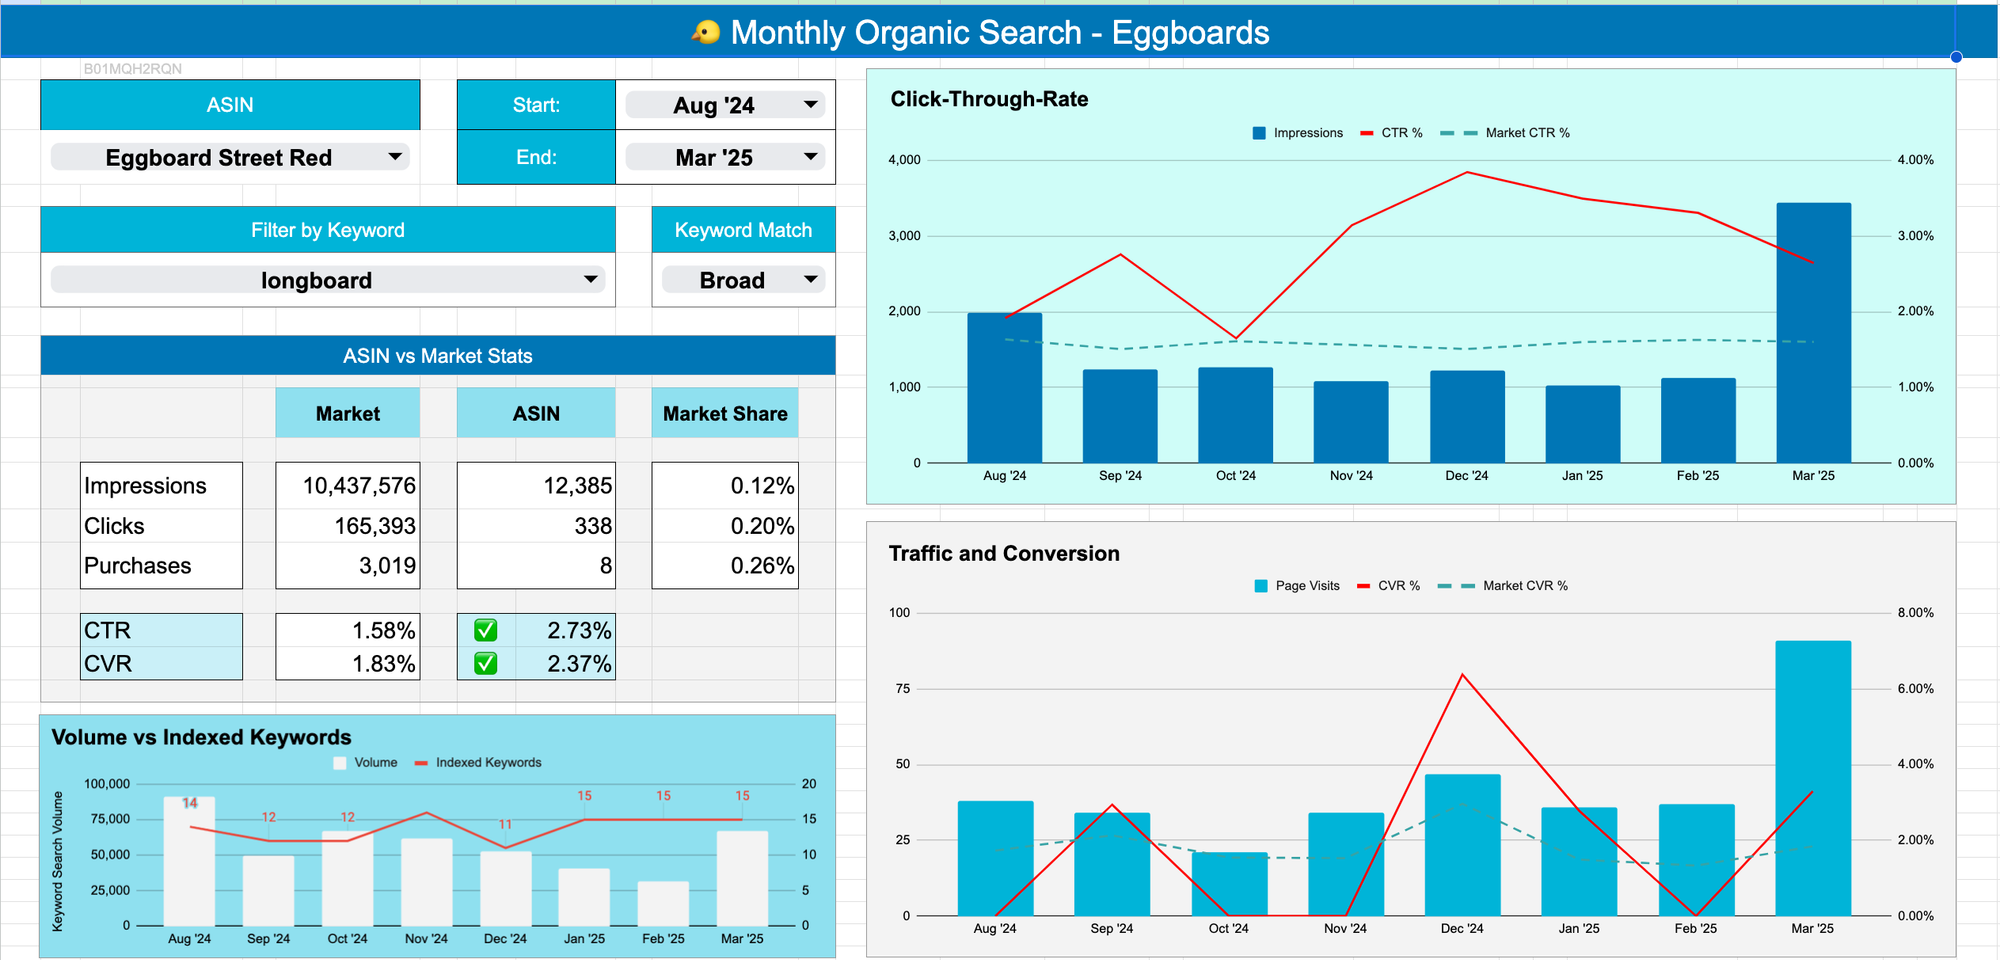
2. Use Amazon Search Query Performance to Track Long-Tail Keywords
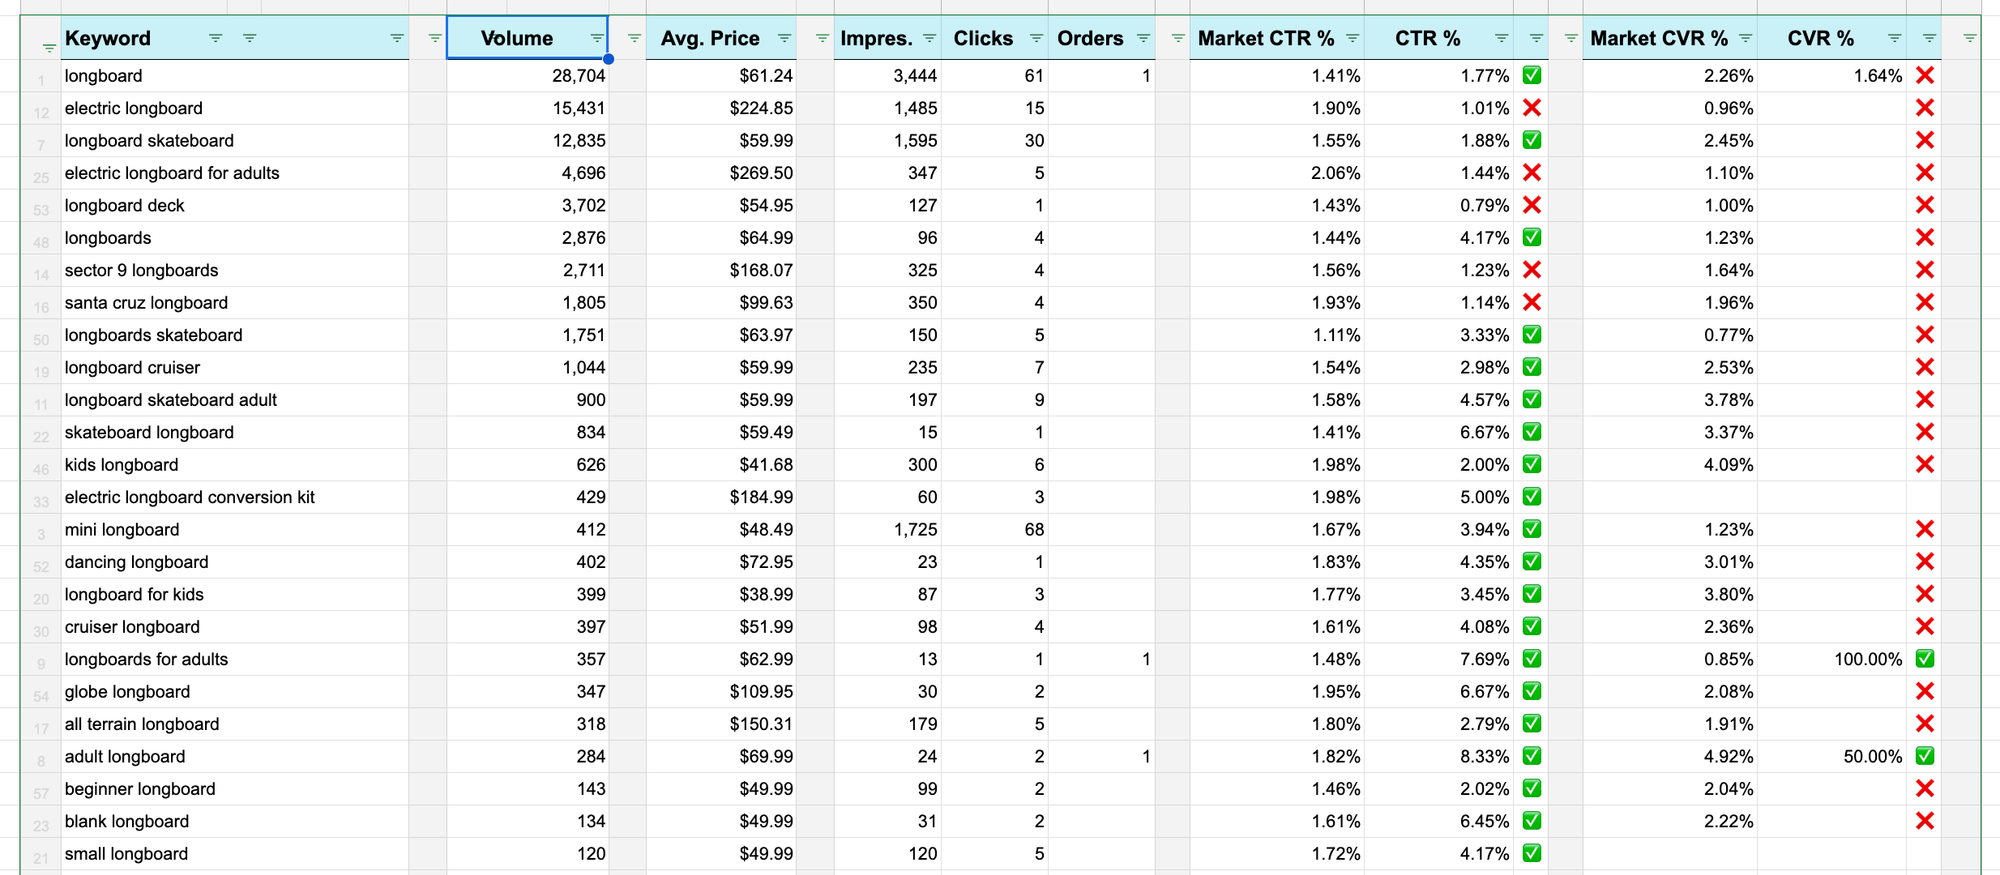
Let’s say my product ranks for “longboard.” I want to know every long-tail keyword with “longboard” in it. You can easily see it on my Google Sheet:
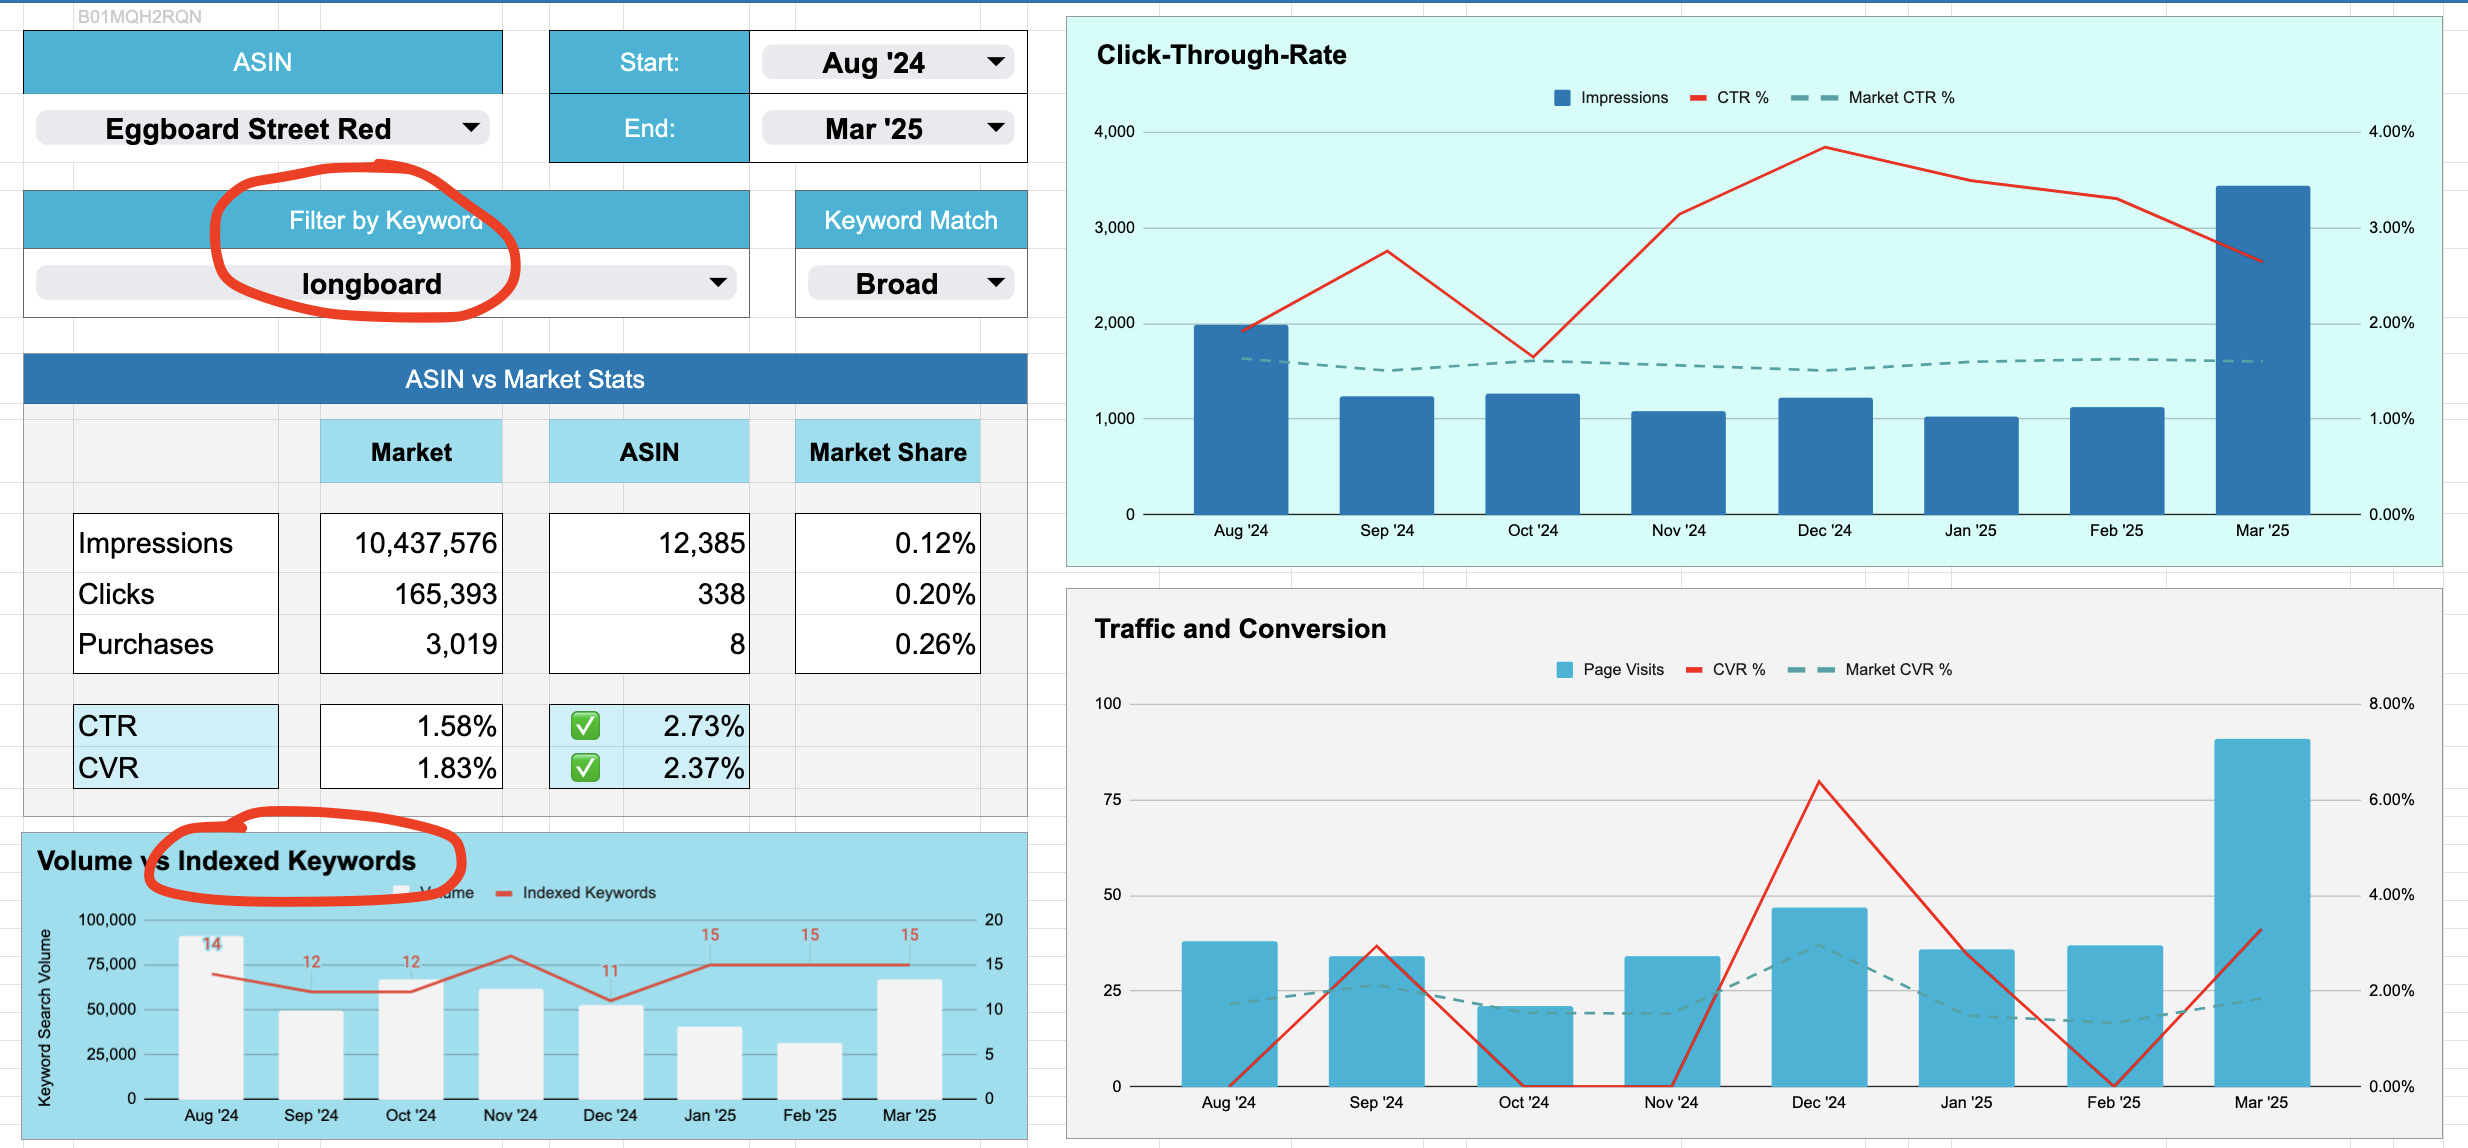
In the report itself, it’s hard to isolate those. But with my spreadsheet? Just set a filter and boom—instant segmentation.
Here’s the link to the Google Sheet again. It does all that for you 👇
✅ Filter by root keyword
✅ Track keyword volume over time
✅ See performance metrics all in one view
Spot Trends Like a Pro
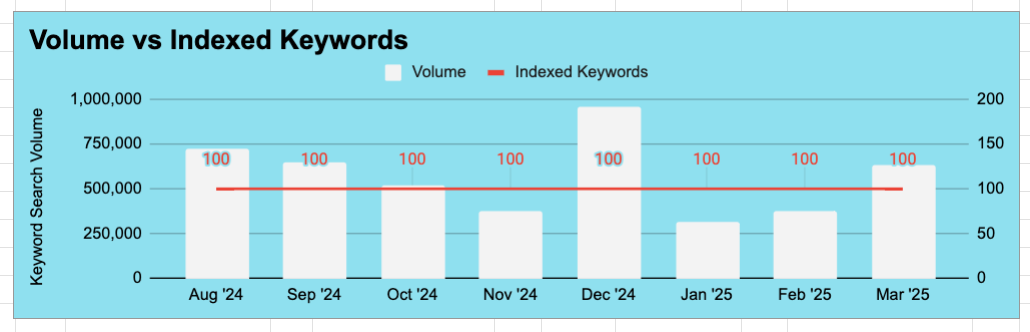
🕶️ Once you’ve exported a few months of data into the sheet, you’ll start to see trends that aren’t obvious inside Seller Central.
For example:
- My keyword volume drops in winter (cold weather = fewer skateboarders ❄️)
- It spikes in December (Christmas gifts 🎄🎁)
- It rises again in spring as the weather improves 🌞
That’s insight you can act on:
- Optimize listings in fall
- Boost PPC in November
- Launch new variants in March
And yes—you can only get this if you consolidate your keyword volume over time in one place. 🧠 Get the spreadsheet here.
How To Use This in your Amazon PPC
🎯 Once you find long-tail keywords with solid volume, but weak performance, that’s your PPC playground.
Run exact match campaigns on:
- Keywords with high volume + low impressions
- Keywords with high click-through rates but few conversions due to low traffic
Use this combo to:
✅ Improve organic rank
✅ Validate keyword fit
✅ Build defensible ranking over time
I often see results in the next month’s brand analytics report. 💥
I wrapped this all up in this video:
Recap: You Don’t Need Expensive Tools
If you're in Brand Registry and not using this report, you’re leaving money—and data—on the table.
Here’s what to do next:
- Enroll in Brand Registry. Check out this post on how to file a trademark using ChatGPT
- Go to Brand Analytics → Search Query Performance
- Export your weekly or monthly data
- Plug it into this Google Sheet
- Start making smarter keyword decisions 💡
If you found this helpful and want a full video tutorial of the sheet in action, drop a comment and let me know 🎥👇
This is just the first post in a series where we’ll go deep into:
- Click-through rates
- Conversion data
- Market share vs. your competition
So stay tuned and…
💌 Subscribe to my blog here for the next ones + your free keyword volume tracker sheet.
Happy ranking,
Dobro